
The FLANK stack can be used for processing endless streams of events.
This article is somewhat of an experiment. I am not going to tell you that you must use BPMN for your business process diagrams. I am not going to tell you I am good at it. A fellow Café Associate suggested that I look at BPMN as a popular technique for describing business processes. I am more used to other techniques such as UML or Archimate. But how do you learn? In this case I set myself the task of explaining Data Streaming, such as that implemented in a FLaNK stack.
FLaNK Stack
So what is the FLaNK stack? It comes up as an option when you are considering how to stream your data continuously from where it is generated to where it can be can be used in a big data way.
The name comes from bringing together three main tools in data streaming.
N – Apache NiFi gets rapidly changing data from the edge (where it is generated) to where it can be used in a Big Data way.
K – Typically the place which receives all this data (from NiFi and other sources) is Apache Kafka. You can think of Kafka as a durable message broker. It wont lose messages, and can be configured to store several days or weeks of messages, and it makes those messages available to any number of clients interested in the particular topic that the message is in.
FL – The data in Kafka might be processed by hand coded client applications, or through the Kafka Streams techniques, or through Spark Streaming, or in the case of the FLaNK stack, the Apache Flink system.
If you can come up with a better acronym I am all ears. FLaNK seems to be the name Cloudera have adopted for one of the ways that you can use their suite of data streaming systems. It is being championed by Tim Spann of Cloudera who quite often uses the phrase “Data In Motion”.
Typical Business Process
Having seen a number of organisations implement data streaming solutions I thought I should try to describe what they have in common. This diagram is the result:
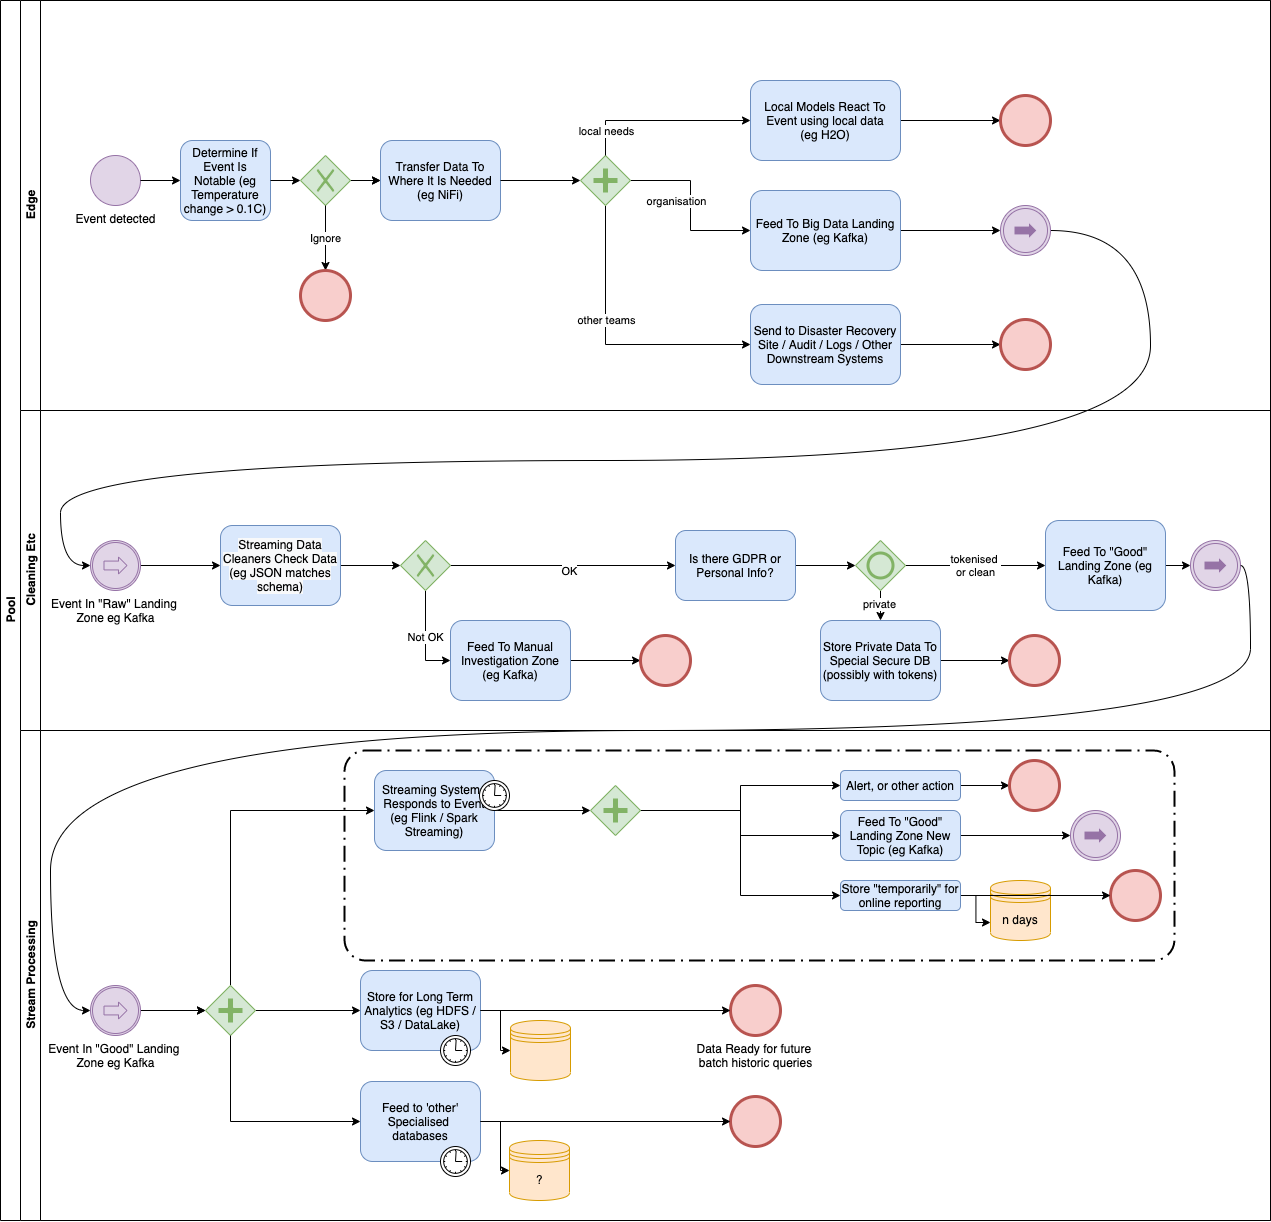 Of course the way to tell a good diagram is to see if it conveys its message without explanation… but I think since this is probably a new topic for you then I can be forgiven this time.
Swim Lanes
Swim lanes in BPMN are typically meant to convey the parts of a process which are done by different people or roles. In the above diagram I have tried to convey three ‘areas’. They are not the only areas but they are typically the first ones which Data Engineers look at when considering data ingestion.
The Edge is where data is generated. This might be a factory sensor, or a mobile app, or more likely a server doing something. It is typically not in the same location as the Big Data infrastructure and in the case of IoT may not even be in a Data Centre.
The next lane I have called “Cleaning Etc“. Data Events pass through this area when they are being checked for valid formats, personal private information, and such like. Typically no users are allowed to view the data here.
Sometimes I call this the Bronze area being the least valuable of Gold, Silver and Bronze.
The “Stream Processing” swim lane is where we start to make use of the data retrieved from the Bronze Area. I sometimes call this the Silver layer.
There is at least one more swim lane which I have not drawn: The Gold layer takes data which has been cleaned, but processed into a uniform model which is specific to the company, or industry. In an ideal world users would only take their data from the Gold layer, but in reality they normally get it from Silver and Gold, so it is hard to keep the two separate.
The Edge
This BPMN diagram starts with the top left event: something has happened which we have measured.
Rather than waiting for hours, with Streaming we want to react to events pretty much as soon as they are generated so there is almost no waiting around.
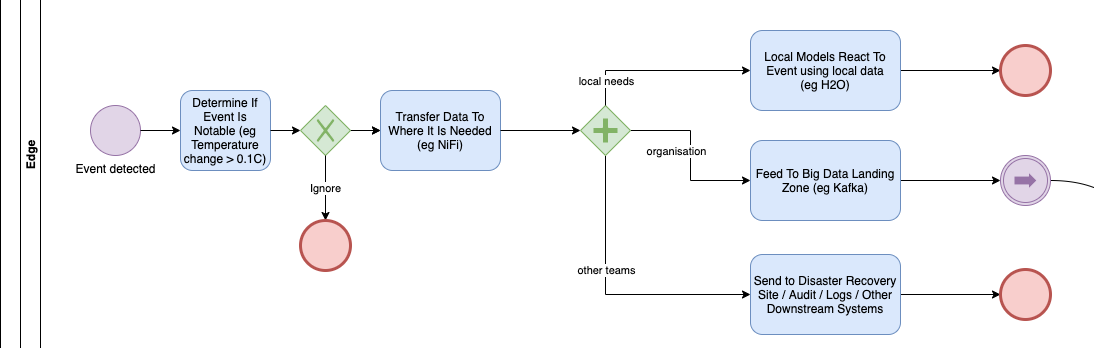 Sometimes the event is just not important and can be thrown away. That needs to be clearly defined because you are trying to predict whether or not the event might be useful in future.
Events are traditionally used locally with rules: eg
- “Switch on fan because Temperature has gone above 70C”.
However those simple rules are often replaced by a previously taught machine learning model. eg
- “Switch on fan because Temperature has gone above the learnt upper temperature of 69.5C”.
The machine learning model may be retrained periodically *elsewhere* to refine those rules.
However not everything can be done here. We generally need to move this data to some centralised Big Data area (sometimes called a Data Lake) where it can be mixed and processed with other information. This transportation is typically done with Apache NiFi, but is increasingly being done by a cut down, low footprint version of NiFi called “Mini NiFi”.
Cleaning Etc (“Bronze” or “Landing Zone”)
The Bronze area is where data lands in the Data Lake (for want of a better expression) but is not yet processed.
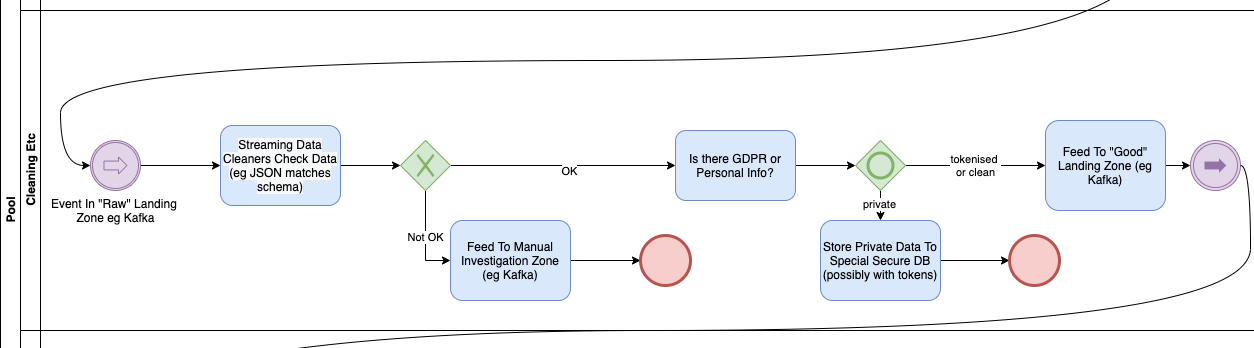 It used to be that data arrived and was put on the end of a set of ever growing log files, typically orchestrated by Hive. Nowadays the most flexible solution is to have Apache Kafka organise the data in its own ‘distributed resilient publish/subscribe’ mechanism. Each type of data is typically put into a ‘topic’ which can be thought of something like a queue.
Typically you will have raw queues for that initial ingestion and something will check the records for proper formatting. (Kafka will store pretty much anything). You will want to push the ill formed records into a separate topic for manual investigation and trouble shooting.
You may then do other checks as kafka clients before pushing the data back into Kafka, but into a “Properly formatted and filtered topic”
Stream Processing (“Silver” and “Gold”)
Now, let’s start to apply some more business logic to this data now that it is useful.
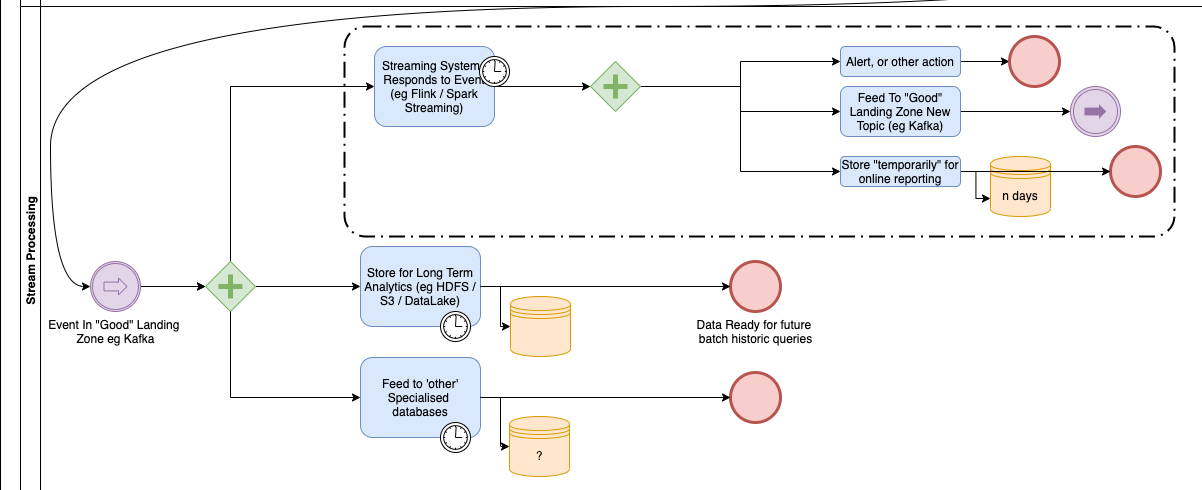 Here we process the data in one of two ways, but also pass the data on to other legacy systems.
The Streaming system processes each event pretty much as it arrives. This may be done inside Kafka itself, or in Kafka clients. One such client may be Apache Flink which is designed for stream processing. These clients often process windows of data over time, for example so that it can see the average of a value over several hours or days. This is quite different from a transactional system where each piece of data is considered individually.
The data is often put into a long term Big Data storage (like the Hive tables I mentioned earlier) because no matter how good your streaming system is, it typically cannot hold ALL the data processed, and you may wish to perform historical analysis of that very old data.
Finally data is also fed to other systems, such as Data Warehouses, for specialised purposes.
The most important next step is to pass data onto the “Gold” systems – which I have not drawn here. In those the data is reprocessed into an Enterprise wide model schema which is independent of the source system where it came from.
The key thing to remember is that as data passes through Bronze, Silver and Gold it is checked, processed, and becomes more valuable to the business.
Conclusion
So has this experiment worked? Have I managed to describe the FLaNK stack using Business Process Modelling Notation?
It is obvious to see BPMN’s similarity to historical flowcharts. They have the advantage of being understood by a wide range of people. Having simple diagrams alows all sorts of people in the organisation to see the architecture of these systems.
It may not the best tool for this. I have effectively forced BPMN into use as a data flow diagram of some kind, which it was not really intended for.
Traditionally when one talked of a “stack” there were clear boundaries between each “layer” in the stack. Here that is not the case. Kafka can provide services to almost any of the other layers. NiFi may be used to transfer data at any stage. Flink may seem the easiest, but it may be used for data cleaning as well as the data stream processing later on.
Hopefully this article has explained some of it.
References
- https://www.flankstack.dev/ a blog talking about FLaNK
- https://www.linkedin.com/in/timothyspann/ Tim Spann of Cloudera
- Photo of a Stream thanks to Karim Sakhibgareev on Unsplash
Author